 |
| October 27, 2020 | Volume 16 Issue 41 |
Designfax weekly eMagazine

Archives
Partners
Manufacturing Center
Product Spotlight
Modern Applications News
Metalworking Ideas For
Today's Job Shops
Tooling and Production
Strategies for large
metalworking plants
How to Calculate the Estimated Fatigue Life of a Disc Spring
 By John Leckfor, Applications Engineer,
SPIROL International Corporation, U.S.A
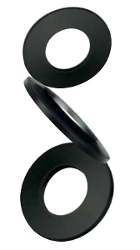
Disc Springs are conically shaped washers designed to provide predictable and repeatable results. This paper focuses on the use of Disc Springs and how to estimate fatigue life in dynamic situations.
In discussing fatigue life, it is important to distinguish between Disc Springs and Conical Spring Washers.
- Disc Springs differ from Conical Spring Washers by design and intended usage. Conical Spring Washers are designed to provide a static thrust load in bolted joints and should not be used in fatigue applications. Conical Spring Washers are specified by DIN 6796.
- Disc Springs may be used to apply either static or dynamic loads and are specified by DIN EN 16983 (formerly DIN 2093). Typically, Disc Springs have a thinner cross-section than Conical Spring Washers. Some variation in size is permissible, but calculations only apply to spring steels and when the ratio of the outside diameter to thickness is between 16 and 40 and the ratio of OD to ID between 1.8 and 2.5.
Deflection of a Disc Spring at a given load is predictable, making it possible to calculate force and stress levels in the Disc. As the Disc Spring flexes, stress levels in the Disc change; the greater the change, the faster the Disc Spring fatigues.
Tensile stress at points II and III in Figure 1 are critical in determining fatigue life. These locations are where fatigue cracks originate. Estimation of fatigue life requires evaluation of the maximum stress difference between preload and final load at locations II and III. The location with the highest stress differential is used to estimate fatigue life. Once it is determined which stress values will be used (from location II or III), the fatigue life charts in DIN EN 16983 can be used to estimate the fatigue life of the Disc Spring.

Stress values may be found in the Disc Spring product catalog, DIN EN 16983, or calculated using formulas in DIN EN 16984. Fatigue life charts are provided in three thickness ranges: < 1.25mm, between 1.25mm and 6mm, and between 6mm and 14mm.
The following examples explain how to interpret the fatigue life charts.
Example 1:
Estimate the fatigue life of a DIN EN 16983 Series B Group 2, DSC 50 x 25.4 x 2 Disc Spring with a preload of 15% of its initial height with a final position at 75% of its initial height.
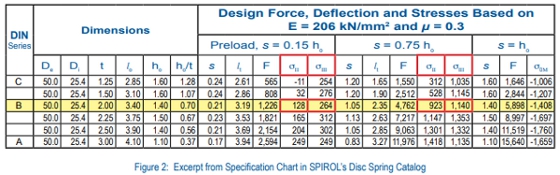
Using the specification chart (shown in Figure 2), Stress II (σII) at 15% is 128 N/mm2 and Stress III (σIII) is 264 N/mm2. Stress II (σII) at 75% is 923 N/mm2 and Stress III (σIII) is 1,140 N/mm2. Now calculate the differences between the stress at each location.

As seen in the calculation above, the maximum differential in stress occurs at location III, therefore we will use the stress values from location III and the fatigue life charts to estimate the fatigue life of the Disc Spring.
The intersection of a vertical line drawn on the X-axis representing the minimum stress at location III and a horizontal line drawn on the Y-axis representing the maximum stress at location III is the estimated fatigue life.

In this example and using Figure 3, the line on the X-axis is drawn at 264 N/mm2, and the line drawn on the Y-axis is drawn at 1,140 N/mm2. The intersection is slightly above the "100,000 cycle" line as represented by N = 105 in Figure 3. This represents an estimated fatigue life of slightly less than 100,000 cycles.
Example 2:
Estimate the fatigue life of the same DIN EN 16983 Series B Group 2, DSC 50 x 25.4 x 2 Disc Spring with a preload of 25% of its initial height with a final position at 50% of its initial height:

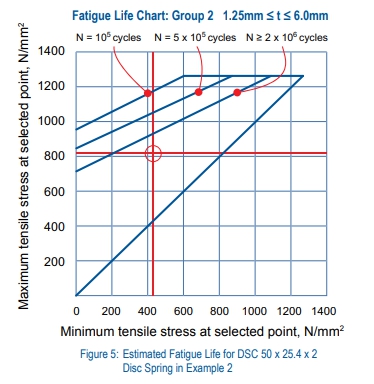
The maximum differential in stress occurs again at location III. Referencing the fatigue life chart in Figure 5 and plotting 430 N/mm2 on the X-axis and 810 N/mm2 on the Y-axis, the intersection of the lines is slightly below the 2 million cycle line; therefore the estimated fatigue life is over 2 million cycles.
Download this SPIROL white paper as a handy PDF for future reference. Click the image above (no registration required). These examples highlight how a reduction in deflection results in an increase in fatigue life. Life charts are based on laboratory testing performed on single Discs at room temperature. Testing is done at a frequency that does not result in heat buildup. Test Discs are lubricated and tested on polished anvils; actual fatigue life is likely to be different than values estimated in the fatigue life charts. These charts are valid for single Discs and stacks of a maximum of (10) Disc Springs in series. Discs Springs stacked in parallel will have reduced fatigue life due to heat buildup resulting from friction. Summary: Download this SPIROL white paper as a handy PDF for future reference here. Learn more at www.spirol.com.
Deflection range of the Disc Spring determines its fatigue life. Increasing final load increases stress in the Disc Spring resulting in lower fatigue life. Increasing preload reduces
deflection resulting in increased fatigue life. The guidelines provided in this paper are general in nature. Testing is necessary under actual conditions to verify fatigue estimates.
Rate this article
View our terms of use and privacy policy